


PRIVACY POLICY
Here’s an updated privacy policy for Digi-Cool.com that reflects best practices for privacy, incorporates some modernization, and emphasizes clarity. I’ve adjusted some areas to make the information clearer, updated sections on cookies and data sharing, and added points on data retention and user rights.
PRIVACY POLICY
Digi-Cool Industries Ltd (“Digi-Cool”) Privacy Policy
What This Privacy Policy Covers
- This policy outlines how Digi-Cool treats personal information collected through our website, products, and services. “Personal information” refers to details that are identifiable to you, such as your name, address, email, phone number, professional status, or other information that is not publicly available.
- This policy does not apply to practices of companies Digi-Cool does not own or control or to individuals Digi-Cool does not employ or manage.
Information Collection and Use
- Personal Information Collection: Digi-Cool collects personal information when you contact us, use our products or services, or participate in promotions. We may also combine this data with information from trusted partners to better understand and meet your needs.
- Information You Provide: When you contact us or register, we may ask for details such as your name, email address, postal code, industry, and contact preferences.
- Transaction Information: Digi-Cool records details of your transactions with us and some of our business partners.
- Automatic Data Collection: We automatically receive and record technical information from your browser, including your IP address, browser type, and pages visited.
- Cookies and Similar Technologies: Digi-Cool may use cookies or similar technologies for advertising and website functionality. Cookies are small text files stored on your device to help us measure the effectiveness of our advertising. These cookies do not store personally identifiable information and typically expire after 30 days. For information on cookies from our advertising providers, please see their privacy policies, such as Google’s privacy policy.
- How We Use Information: Digi-Cool uses collected data to fulfill requests, improve our products and services, communicate with you, and conduct research. If you have opted in, we may contact you with relevant offers.
Information Sharing and Disclosure
- General Non-Disclosure: Digi-Cool does not rent, sell, or share personal information with nonaffiliated companies or individuals, except to fulfill your requests, with your consent, or under these specific conditions:
- Trusted Partners: We may share your information with trusted partners who work under confidentiality agreements with Digi-Cool. These partners may assist us in communicating with you about our services or relevant offers. They have no independent right to share this information.
- Legal Obligations: Digi-Cool may share personal information in response to legal processes, such as subpoenas or court orders, or to establish or exercise our legal rights or defend against claims.
- Safety and Security: We may share information when necessary to investigate, prevent, or respond to suspected fraud, illegal activity, potential threats to physical safety, or as required by law.
- Business Transfers: If Digi-Cool is acquired or merges with another entity, we may transfer personal information as part of that transaction. If this occurs, we will notify you, and the new entity will adhere to the terms of this policy or a similar privacy policy.
Your Rights and Access to Your Information
- You may request access to your personal information or ask us to delete your transaction history. However, Digi-Cool may retain non-personal information about your organization if applicable and necessary for legal or business purposes.
Data Retention
- Digi-Cool retains personal information only as long as necessary to fulfill the purposes outlined in this policy or as required by law. Once no longer needed, we securely delete or anonymize the data.
Confidentiality and Security
- We restrict access to personal information to employees who need it to provide services to you or perform their duties. Digi-Cool employs physical, electronic, and procedural safeguards that comply with regulatory standards to protect your personal information.
Changes to This Privacy Policy
- Digi-Cool may update this policy to reflect changes in our practices. We will notify you of significant updates either by sending a notice to the last provided email or physical address, or by posting the new policy on our website. We encourage you to review this policy periodically.
Contact Us
- For questions or feedback about this policy, please contact us at https://digi-cool.com/company-info/contact-us
AK900

Refrigeration guages
Introducing the AK900.
The AK900 with Manifold is now available from the Digi-Cool Store for just $299.00.
OUT OF STOCK
Amazing performance at an awesome price!
We built one of the world’s first digital refrigeration system analyzers in 1989. Now, we are bringing you the next stage in digital HVAC evolution—the AK-900.
With patented ‘bar-graph technology,’ extreme durability torture tests, and an intuitive ‘tech-focused design’ — the AK-900 is made to help you better understand the loads of data, see the importance of small pressure fluctuations, and better monitor system performance.
Intuitive trouble-shooting
Smart design is based around the needs of techs in the field. From a large LCD display, ‘no toggle’ screen, to user-friendly real time updates, the AK-900 gives you far-reaching refrigeration analysis in a highly readable format.
Deadly accurate. And can take a beating.
Accuracy is why digital beats analog. And the AK-900 kills in this category with .5%. Plus, our famous torture tests show exactly how tough and reliable our tools are. Drown it in rain, crush it with a truck–the AK-900 will work hard for years and years.
Professional tool.
Full support.
We know Digi-Cool products aren’t the cheapest. But we don’t take shortcuts. You get full customer support. Affordable upgrades. And a strong, one-year guarantee.
 Download DRSA AK-900 Data Sheet
Download DRSA AK-900 User Manual
Demonstration
Animated Demonstration
 |
||
 |
 |
|
 |
||
This simulation shows a standard pulldown in an R-22 system. The digital reading is set to update once per second, so you can track the pressure when it changes rapidly. Notice how the bar graph clears to zero when the digits change. You can see that the overall trend is downwards in this pulldown sequence.
The pressure bar graph is patented by Digi-Cool Industries Ltd. and is unique to our products. It shows all the pressure fluctuations never seen before, for quick and accurate diagnostics. ![]() More
More
|
||
|
 |
|
|
||
This demo shows a R410A system operating with a poorly performing TEV. The digital reading is set to update every 5 seconds, and each bar graph shows the change from that reading. If there is a decrease, segments accumulate on the left; increases grow to the right. Each segment on the low side represents 1/4psi of change on the low side, and 1psi on the high side. Notice how the bar graph clears to zero when the digit changes.
The system is fluctuating about 2psi on the low side. The expansion valve is hunting and tracking poorly. With conventional dial gauges, this behaviour would only show as a small movement of the needle, difficult to see unless the needle is closely watched. The large display of the analyzer allows you to quickly spot and diagnose the problem.
The pressure bar graph is patented by Digi-Cool Industries Ltd. and is unique to our products. It shows all the pressure fluctuations never seen before, for quick and accurate diagnostics. ![]() More
More
|
||
|
 |
|
|
||
This demo shows refrigerant floodback. As the liquid floods through the suction line into the compressor, the bar graph fluctuates sharply as the liquid flashes off in the compressor. While large amounts of liquid floodback can be seen with regular gauges, they do not show smaller amounts that also damage compressors; the DRSA shows you the smallest pulses.
The pressure bar graph is patented by Digi-Cool Industries Ltd. and is unique to our products. It shows all the pressure fluctuations never seen before, for quick and accurate diagnostics. ![]() More
More
|
||
|
 |
|
|
||
This demo shows standard system pump down, as the user gets ready to open the system for service. Note that even with the rapid decline of pressure, we can follow the pressure down and shut it down just before reaching 0psi. ’62’ is the trade name shown for HP62 (R-404A). The user can select whether refrigerants are shown by their trade names or ASHRAE designations.
The pressure bar graph is patented by Digi-Cool Industries Ltd. and is unique to our products. It shows all the pressure fluctuations never seen before, for quick and accurate diagnostics. ![]() More
More
|
||
|
 |
|
|
||
This demo shows a hydraulically locked high side. Note the rapid increase in pressure. There is no more room for vapor condensation in the condenser.
The pressure bar graph is patented by Digi-Cool Industries Ltd. and is unique to our products. It shows all the pressure fluctuations never seen before, for quick and accurate diagnostics.
30-06-08(23:01:49)
First Name: c
Last Name: r
Email: funkyjunkie@mac.com
Date of Purchase: June,
Digi-Cool Purchase Information.
DRSA 1200

Inventory clearance sale.
DRSA 1200 Digital Refrigeration System Analyzer. Now ONLY $275.00
Powerful refrigeration gauges for service manifolds, the Digital Refrigeration System Analyzer (DRSA) is revolutionary diagnostic tool for AC/R technicians.
OUT OF STOCK!
You can upgrade your DRSA 1200 to a DRSA1250. This gives you the Backlight
LCD.
Accessories: You can choose these accessories to equip your DRSA 1200
 |
Bar Clamp TB-1120You can choose this Bar Clamp Temperature Sensor to equip your DRSA 1200 and 1600 |
 |
Spring Clamp TS-1120You can choose this Spring Clamp Temperature Sensor to equip your DRSA 1200 and 1600 |
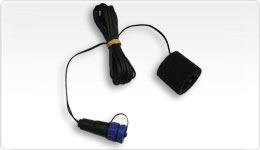 |
Velcro TV-1110This temperature sensor comes with the DRSA 1250. You can get replacement parts at the online store. |
 |
Digital Refrigeration System Analyzer Upgrades: OUT OF STOCK..You can upgrade your DRSA 1200 to a DRSA1250. This gives you the Backlight LCD. |
Benefits & Advantages
The entire service organization stands to benefit from using the Digi-Cool DRSA:
- Quicker, more accurate diagnostics: easily spot hidden problem using sub-psi pressure dynamics
- Simplify cumbersome procedures: convenience, better visibility and less frustration improves productivity and employee morale. Staff see appropriate tools and training as tokens of faith and respect from management.
- Fewer unnecessary or inappropriate repairs: reduce costs on current maintenance contracts, allow you to bid more aggressively for new contracts.
- Rapid payback: Allows you to save 10 – 15 minutes or more at many jobs. Soon the analyzer is paid for and making money for you!
How It Works A set of manifold pressure gauges, it replaces the traditional analog gauges on your favorite service manifold. It shows:
- Pressure readings for the low and high sides
- Pressure fluctuations down to 1/4 psi
- Bubble and dew (or saturation) temperatures for up to 23 selectable refrigerants.
The patented bar graph display shows the smallest modulations about the digital reading. This allows unprecedented diagnostic power, as dynamics of valve modulation and refrigerant flow are easily visible to the technician.
- Bar graph: segments show changes from digital reading
- Range: 2 psi low-side, 8 psi high-side
- In example above, low-side has dropped 2 psi to 63.9 psig since update, high-side has dropped 3 psi to 170 psig since update
- Resolution: 0.1 psi low-side, 1 psi high-side
- Temperatures: corresponding bubble and dew points for current pressures
- Refrigerant: Current selection on bottom left
- Selectable ASHRAE / trade number mode (eg. “R-410B” vs “66 for MP66)
- R- selects active refrigerant
- ZERO automatically calibrates to current atmospheric pressure
- ENG / SI changes between English (PSI, “Hg, °F) and SI (kPa, °C) units
- GA / ABS changes between PSIA and PSIG for English units
- 1SEC / 5SEC / HOLD changes the rate digits are updated
- LCD / changes contrast to fit lighting conditions
How it Works
Video Clip: Operation and Installation
Animated Demonstrations
Standard Pulldown
|
||
|
|
|
|
||
This simulation shows a standard pulldown in an R-22 system. The digital reading is set to update once per second, so you can track the pressure when it changes rapidly. Notice how the bar graph clears to zero when the digits change. You can see that the overall trend is downwards in this pulldown sequence.
The pressure bar graph is patented by Digi-Cool Industries Ltd. and is unique to our products. It shows all the pressure fluctuations never seen before, for quick and accurate diagnostics.
|
||
|
|
|
|
||
This demo shows a R410A system operating with a poorly performing TEV. The digital reading is set to update every 5 seconds, and each bar graph shows the change from that reading. If there is a decrease, segments accumulate on the left; increases grow to the right. Each segment on the low side represents 1/4 psi of change on the low side, and 1psi on the high side. Notice how the bar graph clears to zero when the digit changes.
The system is fluctuating about 2 psi on the low side. The expansion valve is hunting and tracking poorly. With conventional dial gauges, this behavior would only show as a small movement of the needle, difficult to see unless the needle is closely watched. The large display of the analyzer allows you to quickly spot and diagnose the problem.
The pressure bar graph is patented by Digi-Cool Industries Ltd. and is unique to our products. It shows all the pressure fluctuations never seen before, for quick and accurate diagnostics.
|
||
|
|
|
|
||
This demo shows refrigerant floodback. As the liquid floods through the suction line into the compressor, the bar graph fluctuates sharply as the liquid flashes off in the compressor. While large amounts of liquid floodback can be seen with regular gauges, they do not show smaller amounts that also damage compressors; the DRSA shows you the smallest pulses.
The pressure bar graph is patented by Digi-Cool Industries Ltd. and is unique to our products. It shows all the pressure fluctuations never seen before, for quick and accurate diagnostics.
|
||
|
|
|
|
||
This demo shows standard system pump down, as the user gets ready to open the system for service. Note that even with the rapid decline of pressure, we can follow the pressure down and shut it down just before reaching 0psi. ‘62 is the trade name shown for HP62 (R-404A). The user can select whether refrigerants are shown by their trade names or ASHRAE designations.
The pressure bar graph is patented by Digi-Cool Industries Ltd. and is unique to our products. It shows all the pressure fluctuations never seen before, for quick and accurate diagnostics.
|
||
|
|
|
|
||
This demo shows a hydraulically locked high side. Note the rapid increase in pressure. There is no more room for vapor condensation in the condenser.
The pressure bar graph is patented by Digi-Cool Industries Ltd. and is unique to our products. It shows all the pressure fluctuations never seen before, for quick and accurate diagnostics.
Models & Features
- Sleek, compact design
- “Dynamic Offset” bar graph clearly shows modulation of control valves
- Adjustable digital readout update rate: 1 second, 5 second or hold digits.
- One-touch atmospheric pressure calibration.
- Vacuum readings in “Hg
- Easy to read LCD screen with large 3/8″ digits.
- Temperature probe for automatic superheat and subcooling readings
- Max / min pressure monitoring for control set-up
- Automatic power off after 15 minutes preserves battery life; low battery indicator.
- Upgradeable for new and additional refrigerants
- Water resistant and wide temperature range for indoor & outdoor use
- Tough construction with flexible protective boot
- Durable construction and tough case tolerates drops and impacts
- Includes profiles for 25 common refrigerants within:
| R-12 | R-22 | R-134A | R-290 | R-422d |
| R-401A (39) | R-401B (66) | R-402A (80) | R-402B (81) | |
| R-404A (62) | R-406A | R-407C (9000) | R-408A (10) | |
| R-409A (56) | R-410A (20) | R-414B | R-416A | |
| R-417A | R-420A | R-422A | R-502 | |
| R-507 (50) | R-508B | R-600A | R-422b |
![]()
 Download DRSA-1200 Product Specification Sheet
![]() Download DRSA-1200 User Manual
Download DRSA-1200 User Manual