Demonstration
Animated Demonstration
 |
||
 |
 |
 |
 |
||
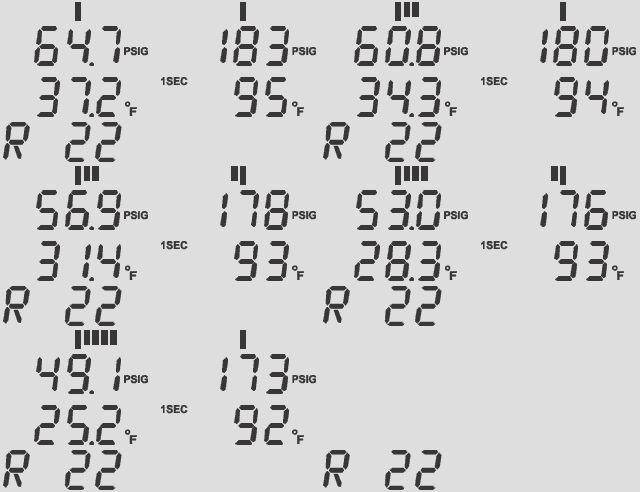
This simulation shows a standard pulldown in an R-22 system. The digital reading is set to update once per second, so you can track the pressure when it changes rapidly. Notice how the bar graph clears to zero when the digits change. You can see that the overall trend is downwards in this pulldown sequence.
The pressure bar graph is patented by Digi-Cool Industries Ltd. and is unique to our products. It shows all the pressure fluctuations never seen before, for quick and accurate diagnostics.  More
More
 |
||
 |
 |
 |
 |
||
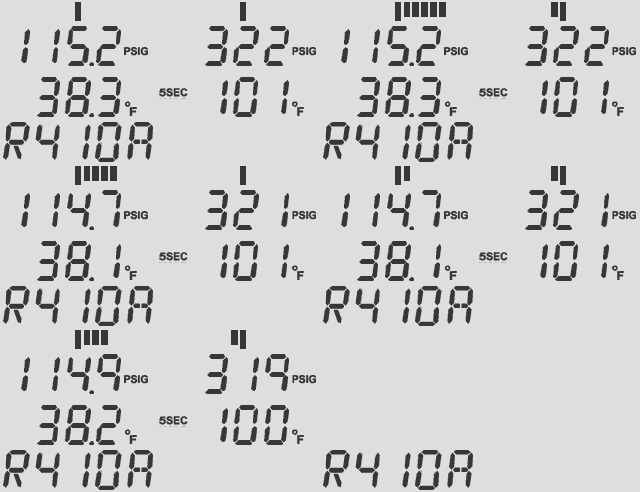
This demo shows a R410A system operating with a poorly performing TEV. The digital reading is set to update every 5 seconds, and each bar graph shows the change from that reading. If there is a decrease, segments accumulate on the left; increases grow to the right. Each segment on the low side represents 1/4psi of change on the low side, and 1psi on the high side. Notice how the bar graph clears to zero when the digit changes.
The system is fluctuating about 2psi on the low side. The expansion valve is hunting and tracking poorly. With conventional dial gauges, this behaviour would only show as a small movement of the needle, difficult to see unless the needle is closely watched. The large display of the analyzer allows you to quickly spot and diagnose the problem.
The pressure bar graph is patented by Digi-Cool Industries Ltd. and is unique to our products. It shows all the pressure fluctuations never seen before, for quick and accurate diagnostics.  More
More
 |
||
 |
 |
 |
 |
||
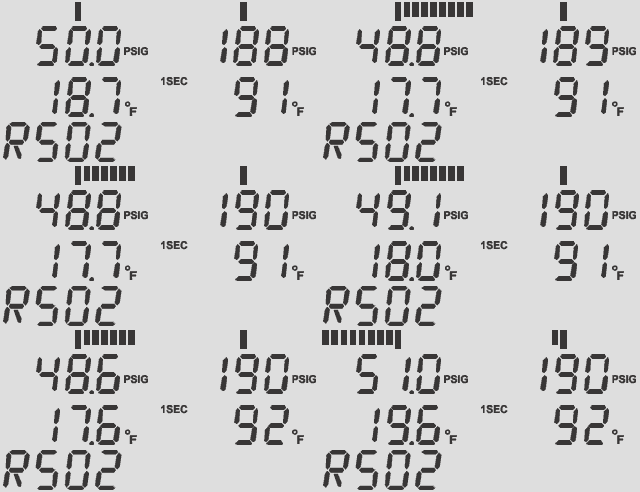
This demo shows refrigerant floodback. As the liquid floods through the suction line into the compressor, the bar graph fluctuates sharply as the liquid flashes off in the compressor. While large amounts of liquid floodback can be seen with regular gauges, they do not show smaller amounts that also damage compressors; the DRSA shows you the smallest pulses.
The pressure bar graph is patented by Digi-Cool Industries Ltd. and is unique to our products. It shows all the pressure fluctuations never seen before, for quick and accurate diagnostics.  More
More
 |
||
 |
 |
 |
 |
||
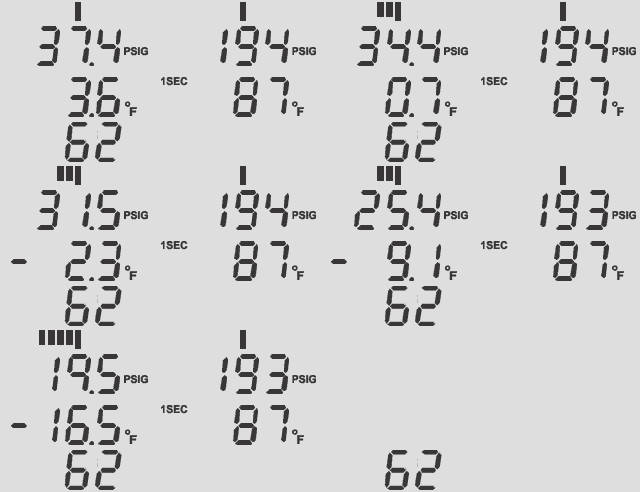
This demo shows standard system pump down, as the user gets ready to open the system for service. Note that even with the rapid decline of pressure, we can follow the pressure down and shut it down just before reaching 0psi. ’62’ is the trade name shown for HP62 (R-404A). The user can select whether refrigerants are shown by their trade names or ASHRAE designations.
The pressure bar graph is patented by Digi-Cool Industries Ltd. and is unique to our products. It shows all the pressure fluctuations never seen before, for quick and accurate diagnostics.  More
More
 |
||
 |
 |
 |
 |
||
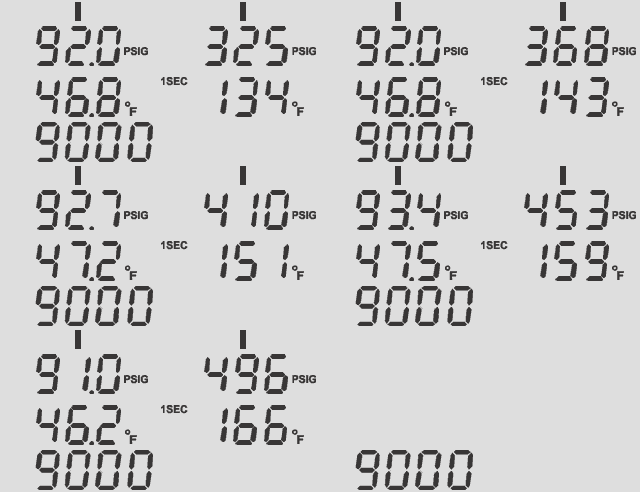
This demo shows a hydraulically locked high side. Note the rapid increase in pressure. There is no more room for vapor condensation in the condenser.
The pressure bar graph is patented by Digi-Cool Industries Ltd. and is unique to our products. It shows all the pressure fluctuations never seen before, for quick and accurate diagnostics.
TV-1140 Review
 Please comment on the new TV-1140 Temperature Sensors.
TB-1140 Review
 Please comment on the new TB-1140 temperature sensors.
TS-1140 Review
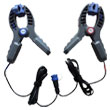 Please comment on the new TS-1140 temperature sensors.
TB-1120 Review
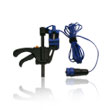 Please comment on the new TB-1120 temperature sensor.
You can purchase this sensor in our online store.
TS-1120 Review
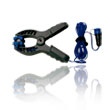 Please comment on the new TS-1120 temperature sensor.


